n8n + Argo = ❤️: Offloading CPU-Heavy Steps to Argo Workflows
Hand heavy steps from n8n to Argo Workflows, release the worker slot, and let a pod do the compute.
n8n and Argo Workflows each do a different job well, and together they cover each other's gaps.
n8n handles event-driven orchestration: it connects hundreds of SaaS APIs, listens to webhooks, transforms JSON payloads, and manages human-in-the-loop approvals.
Argo Workflows runs heavy, isolated container jobs on Kubernetes: batch jobs, video transcoding, and ML pipelines, each in its own pod.
A CPU-heavy step does not belong in an n8n worker's Node.js event loop. Let n8n hand the job to Argo, release its worker slot with a Wait node, and resume when the Argo pod calls back.
In my k3s lab, ten concurrent 30-CPU-second jobs finished with a median execution time of 81 seconds. The n8n workers peaked at 0.07 CPU cores, and a light neighbor workflow kept its baseline queue wait. This article covers the failure that motivates the pattern, the pattern itself, and the lab data.
What does the lab run?
The cluster is the one from the KEDA article: single-node k3s, n8n 2.40.5 in queue mode (main, two webhook processors, KEDA-scaled workers with a concurrency of 10 and a CPU limit of 1 core each), PostgreSQL on CloudNativePG, Valkey as the queue, all deployed by Argo CD. I added Argo Workflows 4.1.4 in a single namespace.
The test job is a synchronous JavaScript loop: xorshift over a 256 MiB typed array, calibrated so one unit costs about one CPU-second on this machine. Both variants run the identical function, so the only difference is where it runs:
- Inline. A webhook triggers a workflow with one Code node that calls
heavy(units). - Offloaded. A webhook triggers a workflow that submits an Argo Workflow running the same function in a
node:26-alpinepod with 1 CPU and 512 MiB, then waits for the pod to call back.
k6 fires 10 jobs at once. At the same time it runs a light neighbor workflow at one execution per second: a 6-second HTTP call, the shape of a typical SaaS sync. That neighbor measures what the heavy jobs do to unrelated work. Timings come from n8n's execution_entity table (queue wait is startedAt minus createdAt) and worker CPU from the metrics API.
Each scenario ran once with 10 jobs, so read the numbers as shapes, not benchmarks. The machine is a 12-core, 24-thread workstation that also runs the rest of the lab.
What breaks when a Code node does heavy work?
At 30 CPU-seconds per job, 9 of the 10 executions failed with Task execution aborted because runner became unresponsive. The one that succeeded finished in 29 seconds. At 10 CPU-seconds per job the result was the same: 1 of 10. At 5 CPU-seconds per job all 10 passed.
| Inline, default runner settings | Executions ok | Median execution time |
|---|---|---|
| 5 CPU-seconds per job | 10/10 | 44 s |
| 10 CPU-seconds per job | 1/10 | n/a |
| 30 CPU-seconds per job | 1/10 | n/a |
The cause sits in how n8n runs Code nodes. With the default N8N_RUNNERS_MODE=internal, the worker launches a task runner as a child process, and ps in the worker pod shows it as a second Node process next to n8n worker. The runner has one event loop. When the task broker offers the runner a task, the runner has to acknowledge it within N8N_RUNNERS_TASK_ACCEPT_TIMEOUT, which defaults to 2 seconds in n8n 2.40.5. A runner stuck in a synchronous loop cannot acknowledge anything. After three consecutive missed acknowledgements the broker declares the runner unresponsive and restarts it, and every task running on it aborts. The worker log shows the sequence:
Runner (4w6aiSeMoixrVB-hWUW7J) took too long to acknowledge acceptance of task (hC9eTMmw)
Task runner failed heartbeat check, restarting...
Task execution aborted because runner became unresponsive
The default N8N_RUNNERS_MAX_CONCURRENCY is 5 tasks, but one thread cannot run a synchronous loop for a second task until the first one returns, so concurrency inside the runner is nominal for CPU-bound code. At 5 CPU-seconds per job the runner survived and the ten jobs finished in sequence, in about 50 seconds. I did not bisect the failure threshold between 5 and 10 CPU-seconds.
Can you tune your way out?
Partly. I raised the four runner limits on the workers (N8N_RUNNERS_TASK_ACCEPT_TIMEOUT, N8N_RUNNERS_HEARTBEAT_INTERVAL, N8N_RUNNERS_TASK_TIMEOUT and N8N_RUNNERS_TASK_REQUEST_TIMEOUT, all to 900 seconds) and set N8N_RUNNERS_MAX_CONCURRENCY=10. All ten 30-second jobs then succeeded, with a median execution time of 305 seconds.
That number is the problem. The runner processes one synchronous task at a time, so ten 30-second jobs take about 300 seconds on a worker, and the others sit inside the runner while the worker shows free slots. KEDA saw almost no backlog. Its Redis trigger watches the waiting list, and the tasks queued inside the runner never appear there, so the Deployment peaked at 2 workers. Adding CPU to the pod does not help either, because a single-threaded runner cannot use more than one core.
Tuning turns failures into a serial queue. It also removes the protection the limits provide: a task that hangs now holds a runner for 15 minutes.
How does the offload work?
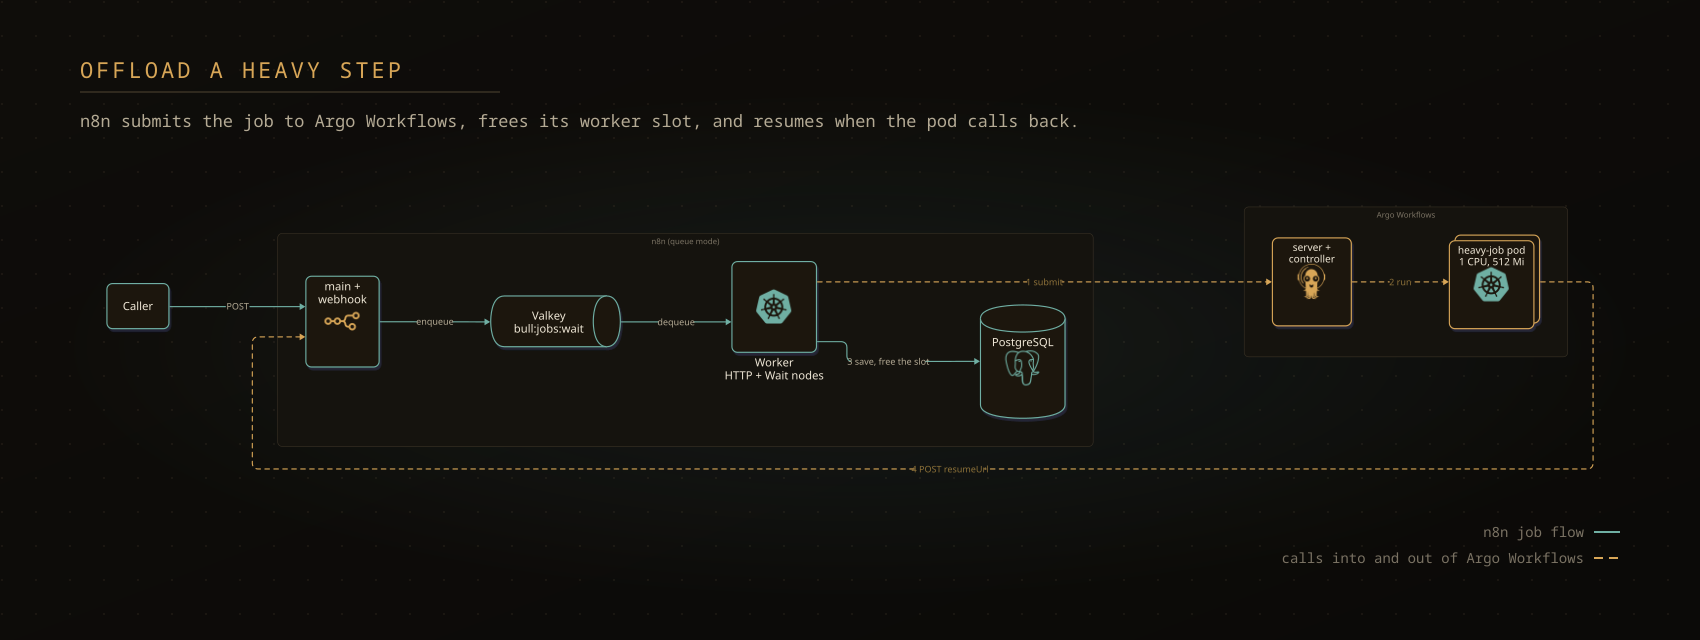
The offloaded workflow has three nodes. The flow:
- Submit. An HTTP Request node posts to the Argo server's submit endpoint, naming a
WorkflowTemplateand passing the job parameters plus the execution's resume URL. - Wait. A Wait node set to resume on a webhook call saves the execution and releases the worker.
- Callback. When the job ends, an exit handler in the Argo Workflow posts the status to the resume URL, and n8n continues the execution.
The submit call is a plain REST request. The body names the template and passes $execution.resumeUrl, the unique URL n8n generates for the Wait node of that execution:
POST http://argo-workflows-server.argo-workflows.svc:2746/api/v1/workflows/argo-workflows/submit

={{ JSON.stringify({
  resourceKind: "WorkflowTemplate",
  resourceName: "heavy-job",
  submitOptions: { parameters: [
    "job-id=" + $execution.id,
    "units=" + ($("Webhook").first().json.body.units || 30),
    "callback-url=" + $execution.resumeUrl
  ] }
}) }}
The template (trimmed here) runs the job in its own pod with its own CPU and memory, and calls back from an onExit handler so a failed job resumes n8n as well:
apiVersion: argoproj.io/v1alpha1
kind: WorkflowTemplate
metadata:
  name: heavy-job
spec:
  serviceAccountName: argo-workflow
  entrypoint: heavy
  onExit: callback
  arguments:
    parameters:
      - name: job-id
      - name: units
        value: "30"
      - name: callback-url
        value: ""
  templates:
    - name: heavy
      script:
        image: node:26-alpine
        command: [node]
        source: |
          // the same heavy(units) function as the Code node
          console.log(heavy({{workflow.parameters.units}}));
        resources:
          requests: { cpu: "1", memory: 384Mi }
          limits: { cpu: "1", memory: 512Mi }
    - name: callback
      container:
        image: node:26-alpine
        command: [node, -e]
        args:
          - |
            fetch(process.argv[1], {
              method: 'POST',
              headers: {'Content-Type': 'application/json'},
              body: JSON.stringify({jobId: process.argv[2], status: process.argv[3]}),
            });
          - "{{workflow.parameters.callback-url}}"
          - "{{workflow.parameters.job-id}}"
          - "{{workflow.status}}"
The Wait node releases the worker immediately. In the lab, the offloaded execution's stoppedAt was 0.4 seconds after it started, and its status in PostgreSQL was waiting until the callback arrived. The n8n documentation describes the 65-second persistence threshold for time-based waits; I observed that a webhook-resumed Wait persists the execution at once.
How does n8n authenticate to Argo?
The lab gives n8n its own ServiceAccount, n8n-submitter, with a long-lived token and a Role that allows only what the submit call needs:
rules:
  - apiGroups: ["argoproj.io"]
    resources: ["workflowtemplates"]
    verbs: ["get"]
  - apiGroups: ["argoproj.io"]
    resources: ["workflows"]
    verbs: ["create", "get", "list", "watch"]
The Argo server runs with --auth-mode=client and --auth-mode=server. A request that carries a bearer token acts as that ServiceAccount, so n8n gets exactly the Role above, and a request with an invalid token gets a 401. In n8n the token lives in a Header Auth credential (Authorization: Bearer <token>), which the bootstrap job creates from the Secret.
The server mode is the catch. A request with no token acts as the Argo server's own ServiceAccount, which is how the UI works behind my SSO proxy. I checked from a pod in the cluster: a call without a token returned 200 and the workflow list. Client mode alone does not close that, because it only constrains callers that identify themselves. The lab restricts who can reach the server instead, with a NetworkPolicy that admits Traefik (the UI path) and the n8n namespace and nothing else. A pod in default and a pod in the Argo namespace both fail to connect, and n8n still submits. Anything in the n8n namespace can still call without a token, so the policy narrows the exposure and does not remove it. In production, drop the server mode and put the UI behind Argo's SSO mode.
What did offloading change?
All ten jobs succeeded at every size. Offloading kept the workers nearly idle and left the neighbor workflow's queue wait at baseline:
| Path | Job (CPU-s) | Executions ok | Median execution time | Neighbor queue wait p95 / max | Peak workers | Peak worker CPU (cores) |
|---|---|---|---|---|---|---|
| Baseline (neighbor only) | n/a | n/a | n/a | 0.01 s / 0.10 s | 1 | n/a |
| Inline | 5 | 10/10 | 44 s | 4.18 s / 13.8 s | 3 | 1.19 |
| Inline | 10 | 1/10 | n/a | 2.63 s / 9.9 s | 2 | 1.19 |
| Inline | 30 | 1/10 | n/a | 0.03 s / 18.3 s | 3 | 1.58 |
| Inline, runner limits raised | 30 | 10/10 | 305 s | 0.08 s / 9.2 s | 2 | 0.86 |
| Offloaded | 5 | 10/10 | 25 s | 0.01 s / 0.1 s | 1 | 0.07 |
| Offloaded | 10 | 10/10 | 35 s | 0.02 s / 0.04 s | 1 | 0.05 |
| Offloaded | 30 | 10/10 | 81 s | 0.01 s / 0.1 s | 1 | 0.07 |
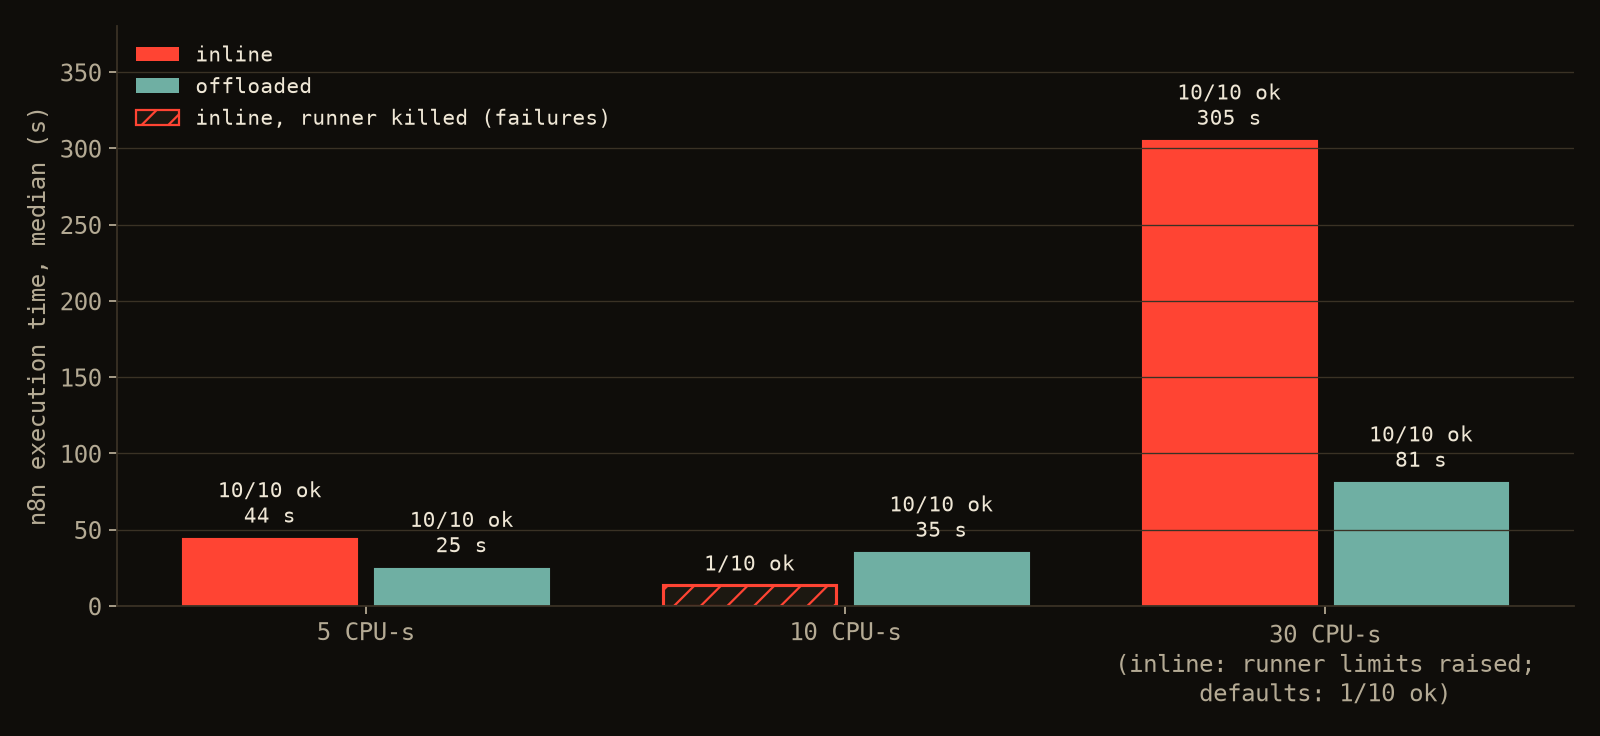
Three effects stand out.
The workers stay idle. While ten 30-second jobs ran, the offloaded workers peaked at 0.07 cores in total, against 0.86 to 1.58 inline. n8n's own n8n_scaling_mode_queue_jobs_active gauge peaked at 6 during the offloaded run, which matches the neighbor workflow's six in-flight executions. The ten heavy jobs held no slots. During the inline runs the same gauge reached 15 to 30.
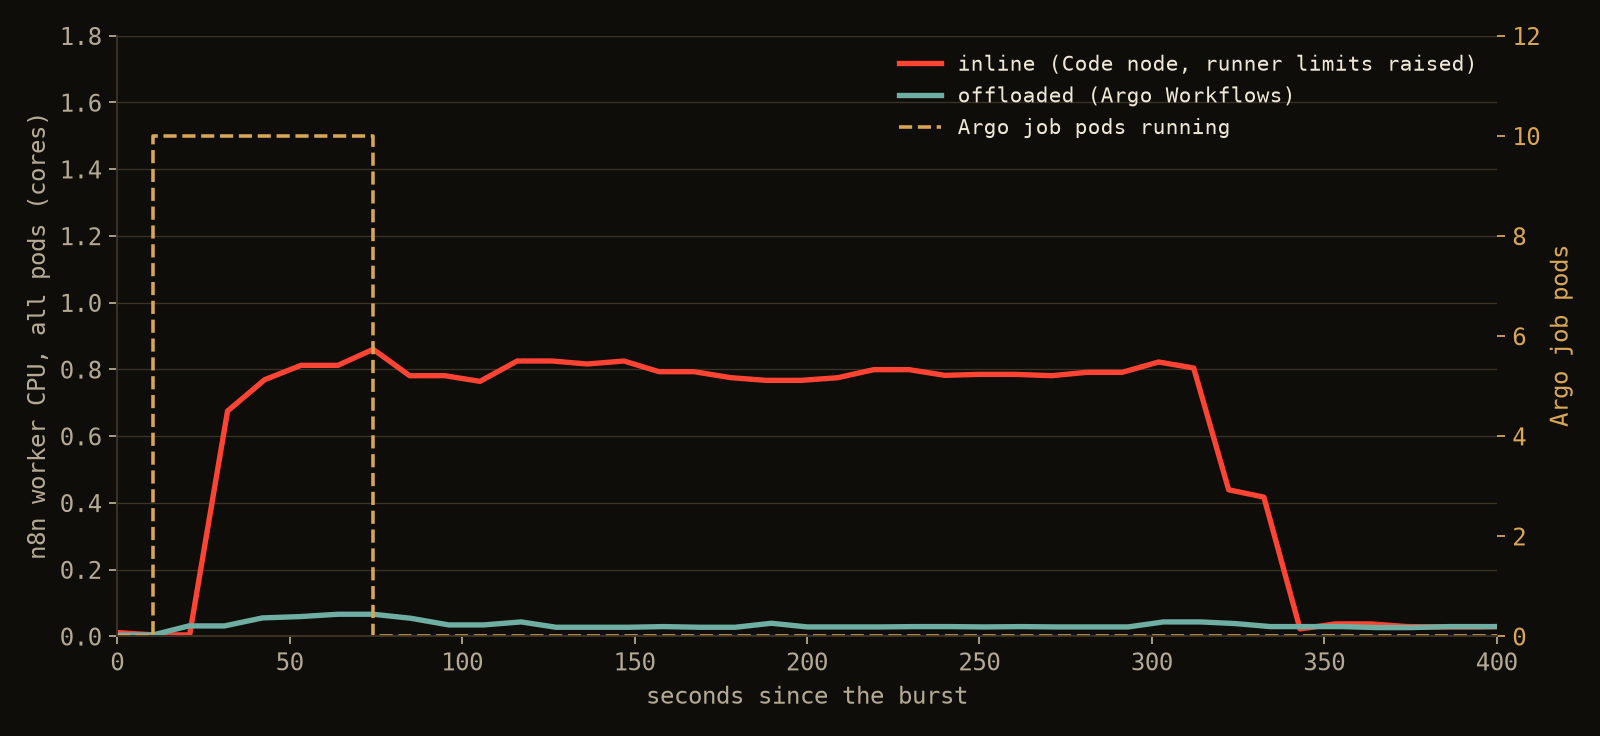
The neighbor keeps its latency. The light workflow waited a median of 0.01 seconds in the queue at baseline. With 5-second inline jobs its 95th-percentile wait rose to 4.18 seconds, and with 30-second inline jobs the worst wait reached 18.3 seconds. With offloaded jobs it stayed at the baseline.
KEDA has nothing to react to. The offloaded runs never scaled the workers past 1. The workers do not need more replicas, because the work no longer runs in them. The cluster scheduler absorbs it instead, which is the pod-per-step model I contrasted with n8n's queue workers in the KEDA article.
What does offloading cost?
A fixed delay on every job, and capacity that you must supply.
The fixed delay. I ran single jobs one at a time with no other load. A 1-CPU-second job took 1.0 seconds end to end inline and 11.7 seconds offloaded. A 5-CPU-second job took 4.9 seconds inline and 11.7 seconds offloaded. The Argo pod's main container ran for 2 to 6 seconds of that; I did not trace where the rest goes, so I report the total as measured. For a short job, offloading is slower.
The capacity. Argo gives you the cluster scheduler, not extra cores. I submitted N identical 30-second jobs directly to Argo, with no n8n involved, and measured the main container's run time per job:
| Parallel jobs | Median run time per job |
|---|---|
| 1 | 27 s |
| 5 | 43 s |
| 10 | 60 s |
| 20 | 112 s |
The lab node has 12 physical cores and the job walks a 256 MiB array, so I expect shared cores and memory bandwidth to slow concurrent jobs well before the 24 threads run out. I did not isolate the cause. On a multi-node cluster with a node autoscaler, those jobs spread out. On one node, offloading moves the contention from a worker's single core to the node's cores, which is still an improvement because the worker's capacity no longer limits it, but the parallelism is not free.
When should a step leave n8n?
This is my reading of the numbers from one lab, not a general rule.
- Under about 2 CPU-seconds, stay inline. The offload adds about 12 seconds of fixed time, which dwarfs the work.
- A few seconds to about 10, decide by concurrency. A single 5-second job is faster inline. Ten of them at once finished in 25 seconds offloaded against 44 inline, and left the neighbor workflow untouched.
- At 10 CPU-seconds or more, offload. In this lab, the Code node on default settings did not survive ten of them at once.
- Offload anything that needs more CPU, memory, or tooling than a worker pod has. The pod gets its own resource limits and any image you want.
- Leave I/O-bound steps in n8n. Waiting on an API costs the worker a slot but almost no CPU, and KEDA handles it, as the first article shows.
Things this lab did not test: cancelling an n8n execution while its Argo job runs (the job keeps running unless something deletes it), retries through Argo's retryStrategy, the Wait node's time limit when a callback never arrives (the workflow sets 30 minutes), workflowRestrictions to stop a token holder from submitting arbitrary templates, and a multi-node cluster.
Key takeaways
- A Code node runs in one single-threaded task runner per worker. A CPU-bound loop longer than a few seconds makes the runner miss task acknowledgements, and the broker restarts it and aborts every task on it.
- Raising the runner limits avoids the failures and serializes the work: ten 30-second jobs took 305 seconds on one worker.
- Offload with three pieces: an HTTP Request node that submits an Argo
WorkflowTemplate, a Wait node resumed by webhook, and anonExithandler that posts the status to$execution.resumeUrl. - Give n8n its own Argo ServiceAccount with a Role limited to submitting from templates. Client auth mode only constrains callers that send a token, so close the
servermode fallback with a NetworkPolicy or SSO. - Offloading costs about 12 seconds per job in this lab, so keep short jobs inline, and budget cluster capacity for the jobs you hand off.

n8n
★ 5.0Fair-Code Workflow Automation & Agentic AI Platform
Disclosure: I write on this personal blog independently and out of my own accord. Separately, I am also an official technical writer for n8n and a member of the n8n Creators program. All experiments and benchmarks in this article were conducted independently on my own single-node k3s lab cluster. If you choose to try n8n Cloud, using my referral link supports my personal research and lab benchmarks at no additional cost to you.
- Zero per-task execution tax
- Native LangChain & Agentic AI nodes
- Full JavaScript & Python code execution
- 100% self-hostable on Docker & K8s
- 400+ pre-built integrations
Disclosure: If you sign up using this link, I may receive a referral commission at no extra cost to you. I only recommend platforms I actively evaluate or use in professional production.